Event Dime
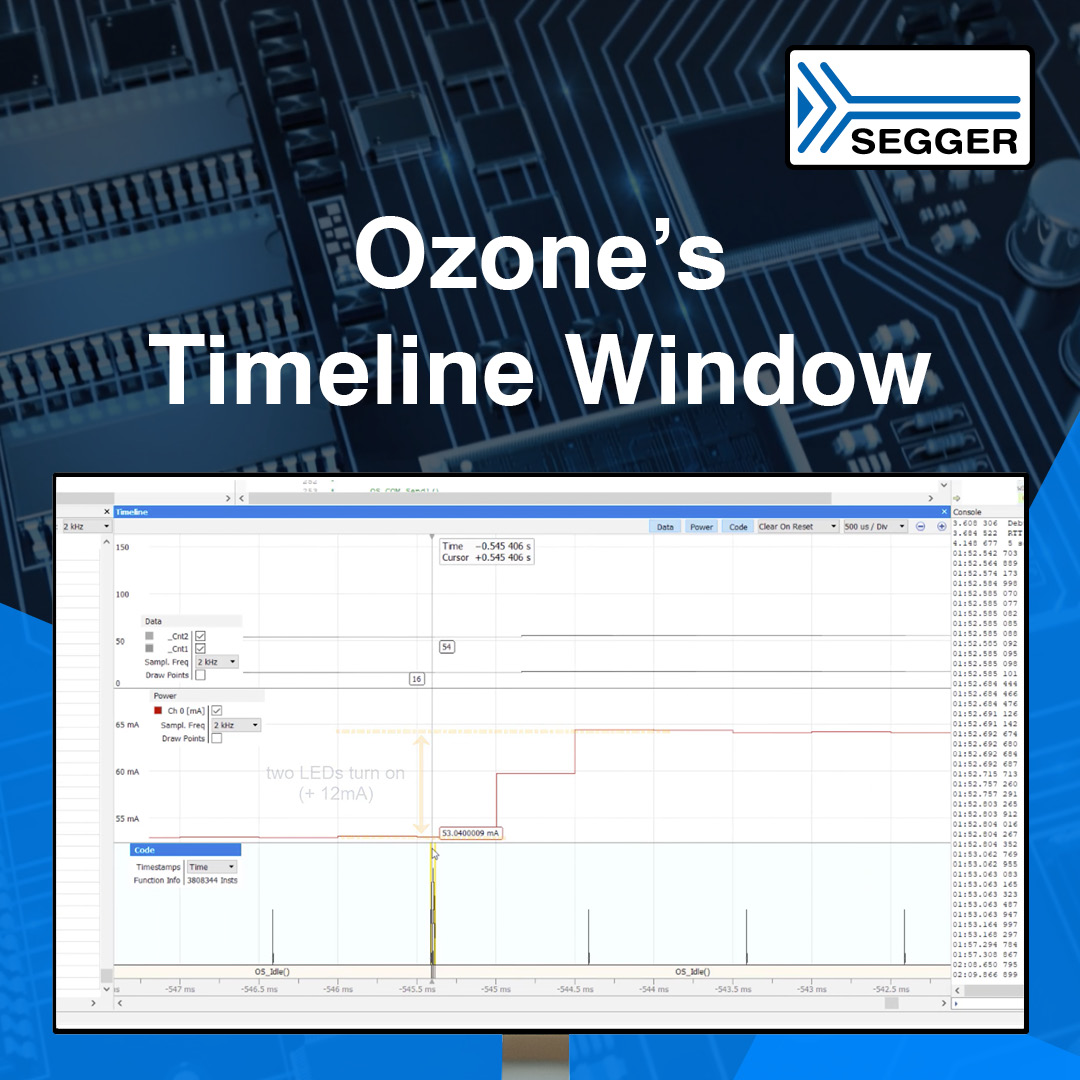
Correlating and visualizing data sampling, current consumption, and program execution via Ozone’s Timeline Window
Arts & Culture
- When:
- January 21, 2021 · 8:16 AM
- Source:
- SEGGER – Software development tools for embedded systems
SEGGER’s J-Trace PRO streaming trace probe and Ozone debugger make a great team. One highlight of this symbiotic relationship is the Timeline window. It allows users to correlate and visualize data sampling, current consumption, and program execution in one combined signal plot. This article takes a closer look at this functionality.